By Dr. Nikos Mazarakis
Professor of Naval Meteorology
2025 can be characterized as another meteorologically difficult year, following 2024. The main reason is that it ranks as the second warmest year since 2017, the period covered by this analysis. Correspondingly, the summer of 2024 was recorded as the second warmest of the same period. In terms of rainfall, 2025 presented significant similarities to 2024, as until September the rainfall levels fluctuated at disappointing levels. However, from October onwards there was a clear change in weather conditions, with the drought giving way to significant and extensive rainfall, which continued during the months of January and February of this year, giving, as the weather data so far evolves, a fairly rich rainfall period. The main conclusion is that climate change proves for 2or year that our region is a "hotspot" where on the one hand the winters are milder but the summers are often unbearable in terms of temperature.
So let's take a more detailed look at the 2025 weather review, separately for each meteorological parameter.
Rainfall
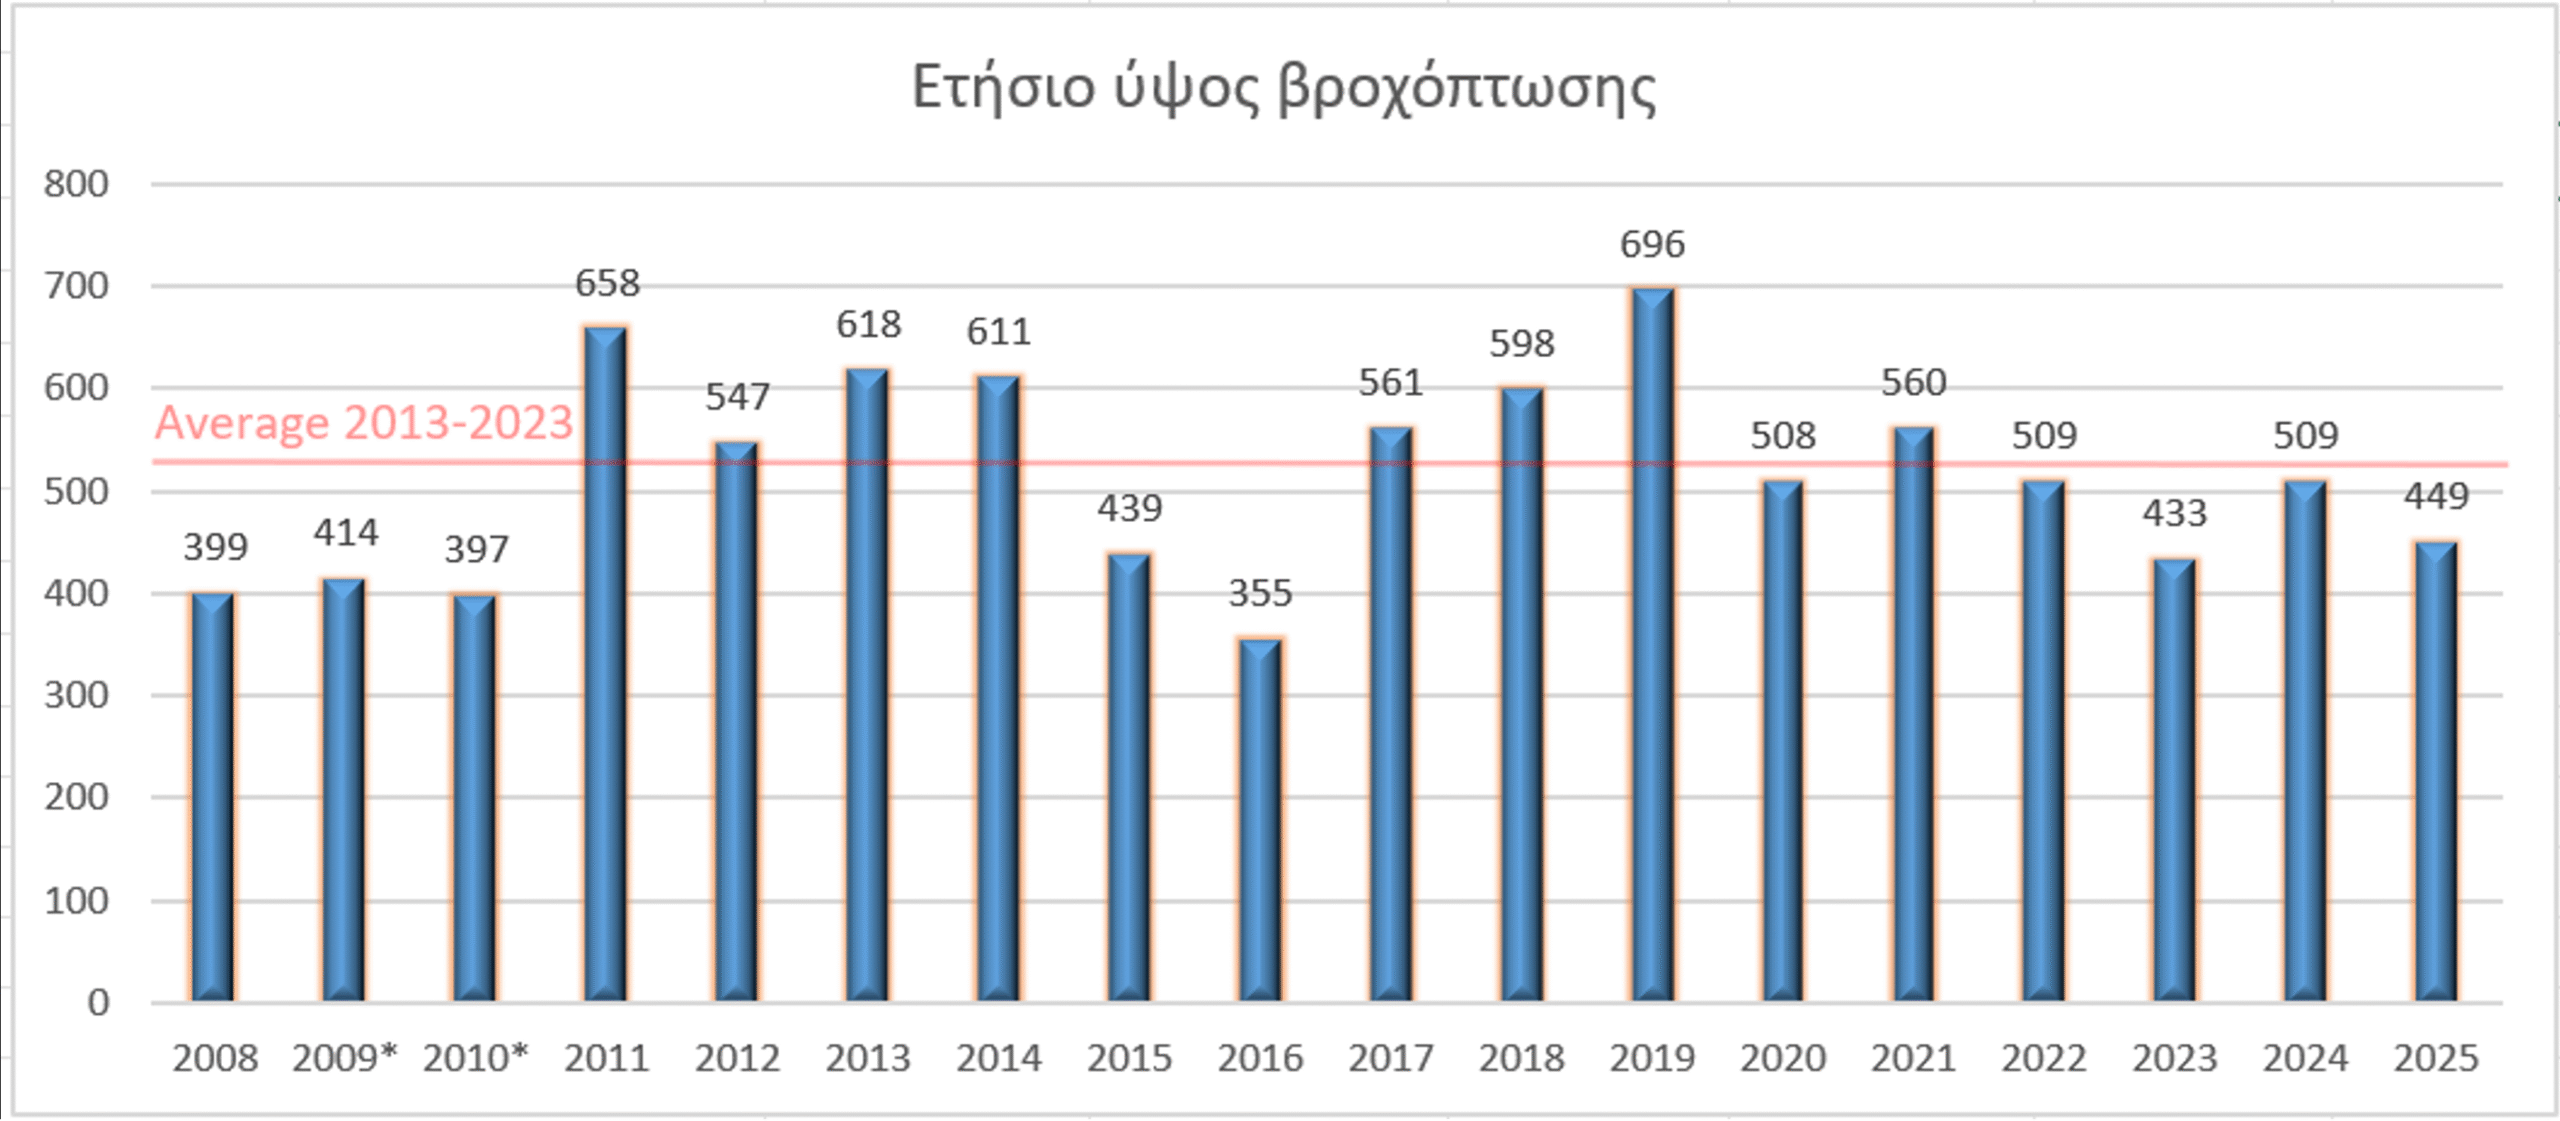
The total rainfall for 2025 amounted to 449 mm, corresponding to 449 tons of water per hectare. As can be seen from Figure 1, this value is lower than the average for the period 2013–2023 (524.6 mm – red line in the diagram). This period is chosen as a basis for comparison, as it does not present data losses due to technical problems (e.g. rain gauge failures or blockages).
Overall, the year can be characterized as below average for the Monemvasia region, but presenting significant intra-annual variation in precipitation, as will be analyzed below.
More specifically, as shown in Figure 2, the year began with generally little rain, since in January only 52.4 mm were recorded, which is 46% of the average value for the period 2013-2023 (see relevant table). In February, the rains that were recorded were slightly above average. More specifically, the rainfall reached 57.6 mm when the average value is 51.7 mm.

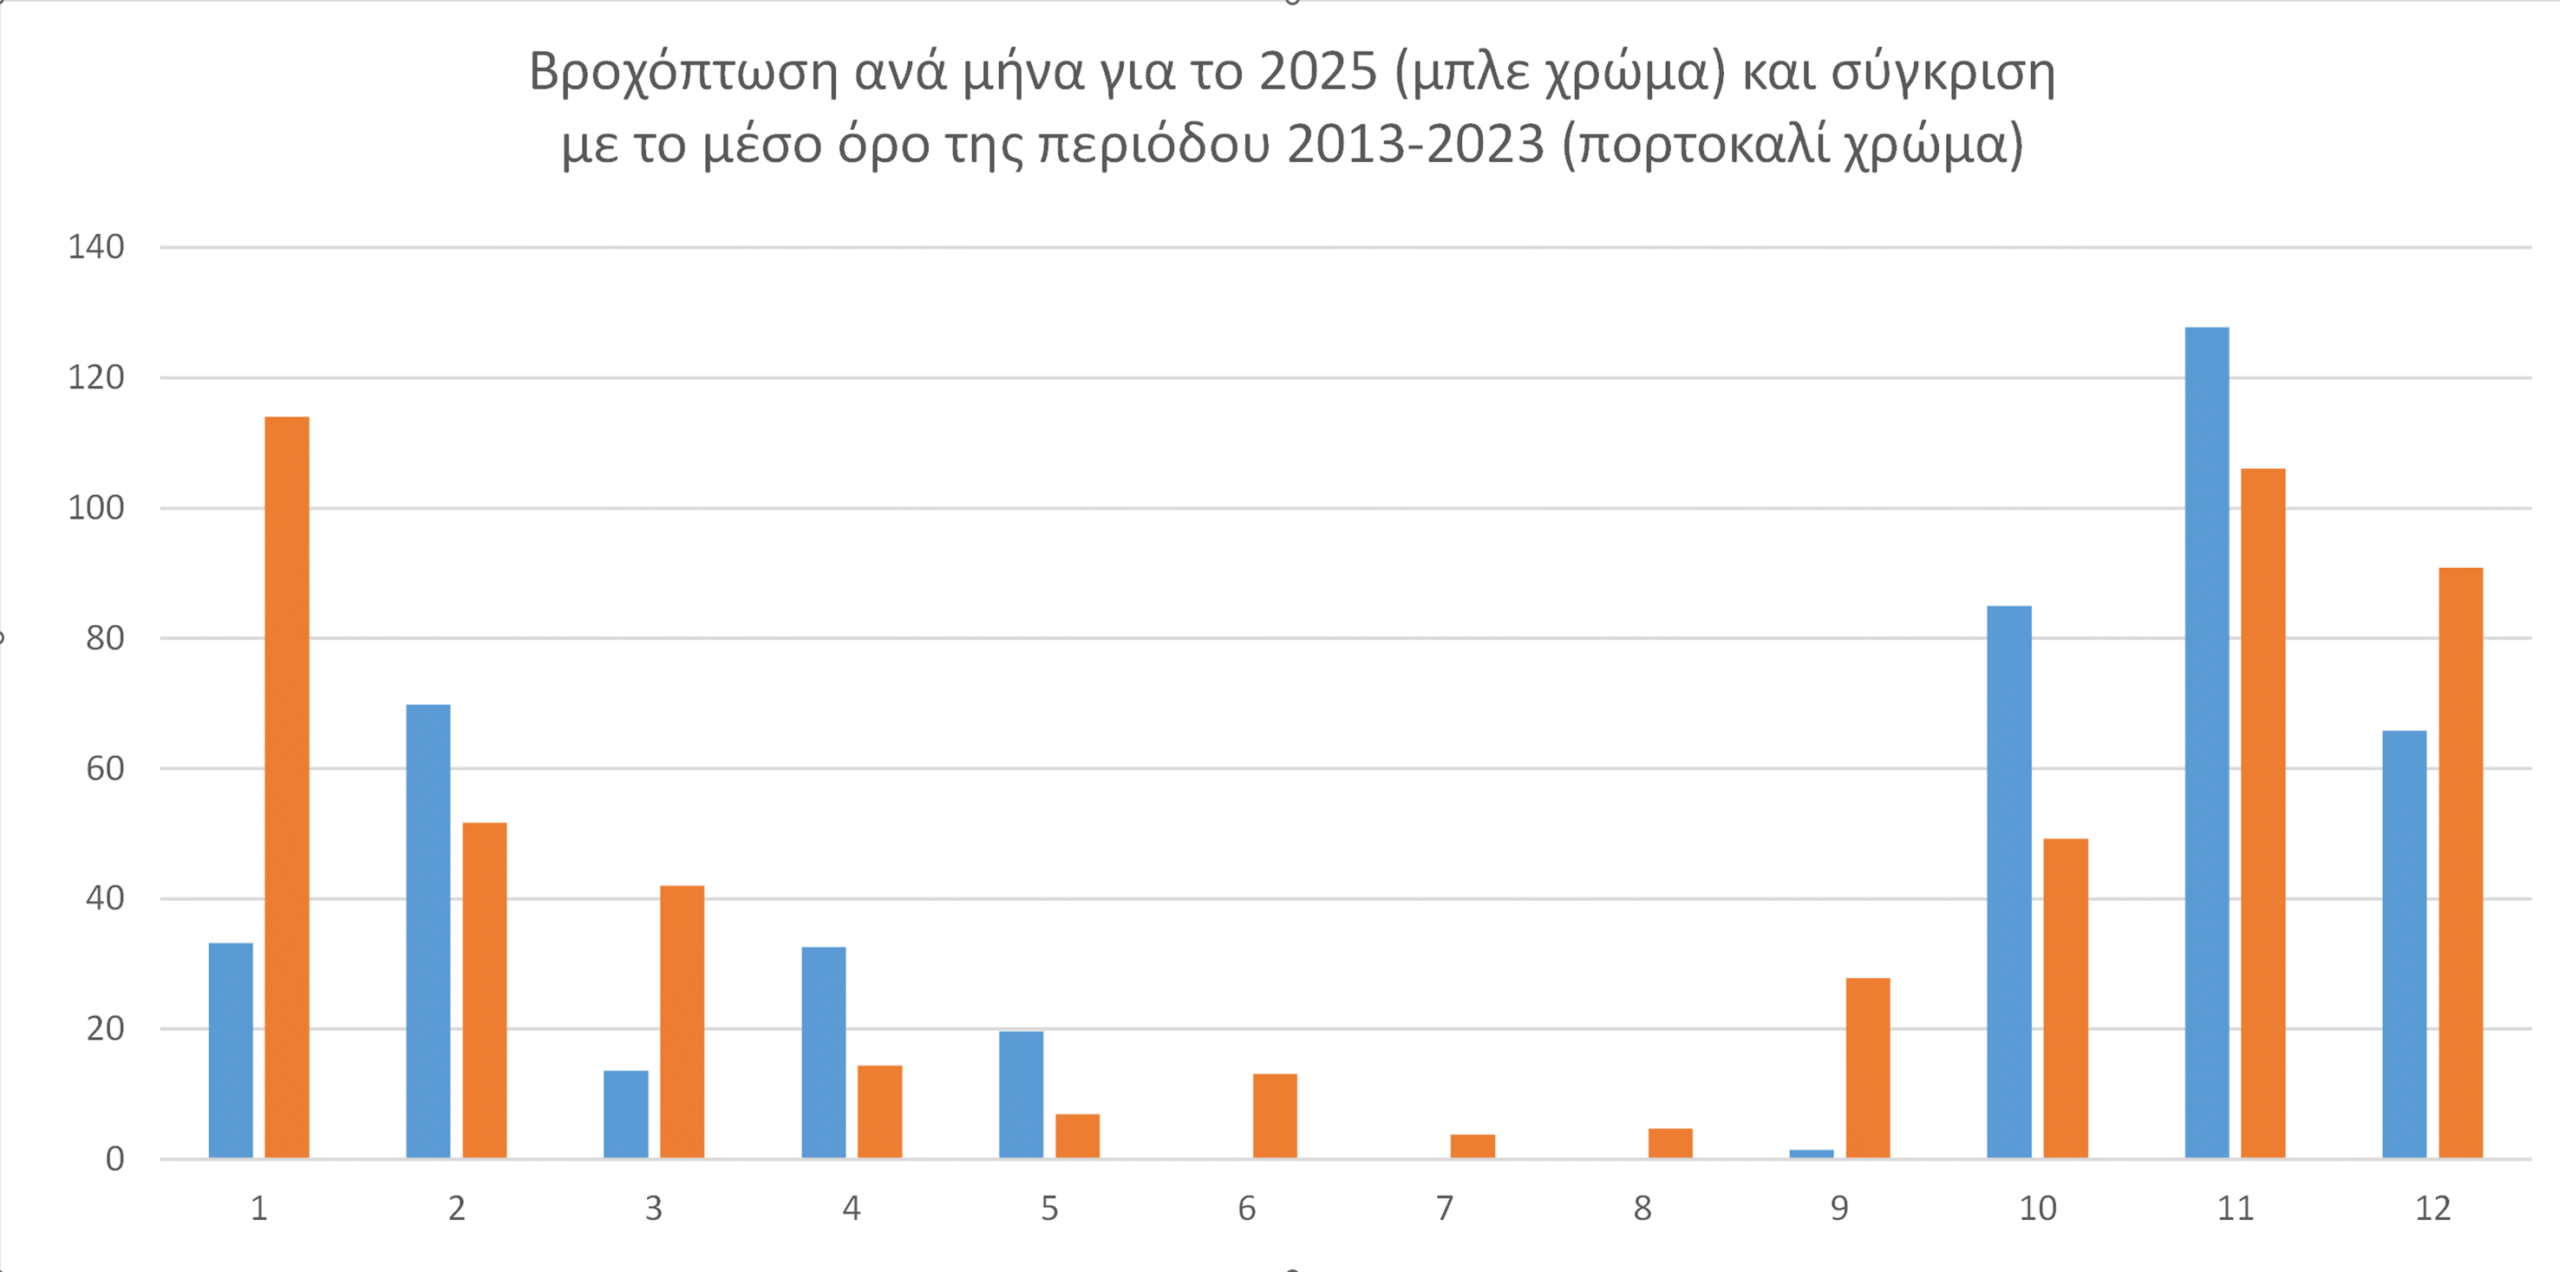
The following April and May with 32.6 mm and 19.6 mm respectively can be characterized as particularly wet, since the climatic value is 14.4 mm and 6.9 mm respectively. The last rain in May fell on the 25th of the month and the next day it rained was the 28th.or September. In other words, our place went a total of 125 days without rain! This is of course partly correct, because on August 15 it rained from Nomia and further south. However, the amount of rain in Gefyra was below 0.2 mm, so it was not recorded by the station. In meteorological history, the previous completely dry summer was that of 2011, while the mere 1.4 mm of September ranks it as the driest September since 2007.
The year had not gone well so far, with only 170 mm of precipitation. However, October and November, which followed, drastically changed the gloomy situation that had developed until then. Thus, 85 mm and 127.8 mm, which are 73% and 20% above the climatic values, gave a breather to the thirsty land of our country. The year ended with 65.8 mm in December, an amount that constitutes 72% of the climatic value.
The days with heavy rainfall, considered those with a daily height of more than 20 mm, were 6, very close to the 5 days we had in 2023 and 2024.
*In this text, the term "Climate value" refers to the average of the period 2013-2023, which is a total of 11 years. Obviously, it is not a climate value in the broad sense, since the time period of 11 years is short for this characterization. Therefore, the term is used purely for reasons of convenience in the formulation of the text.
Temperature
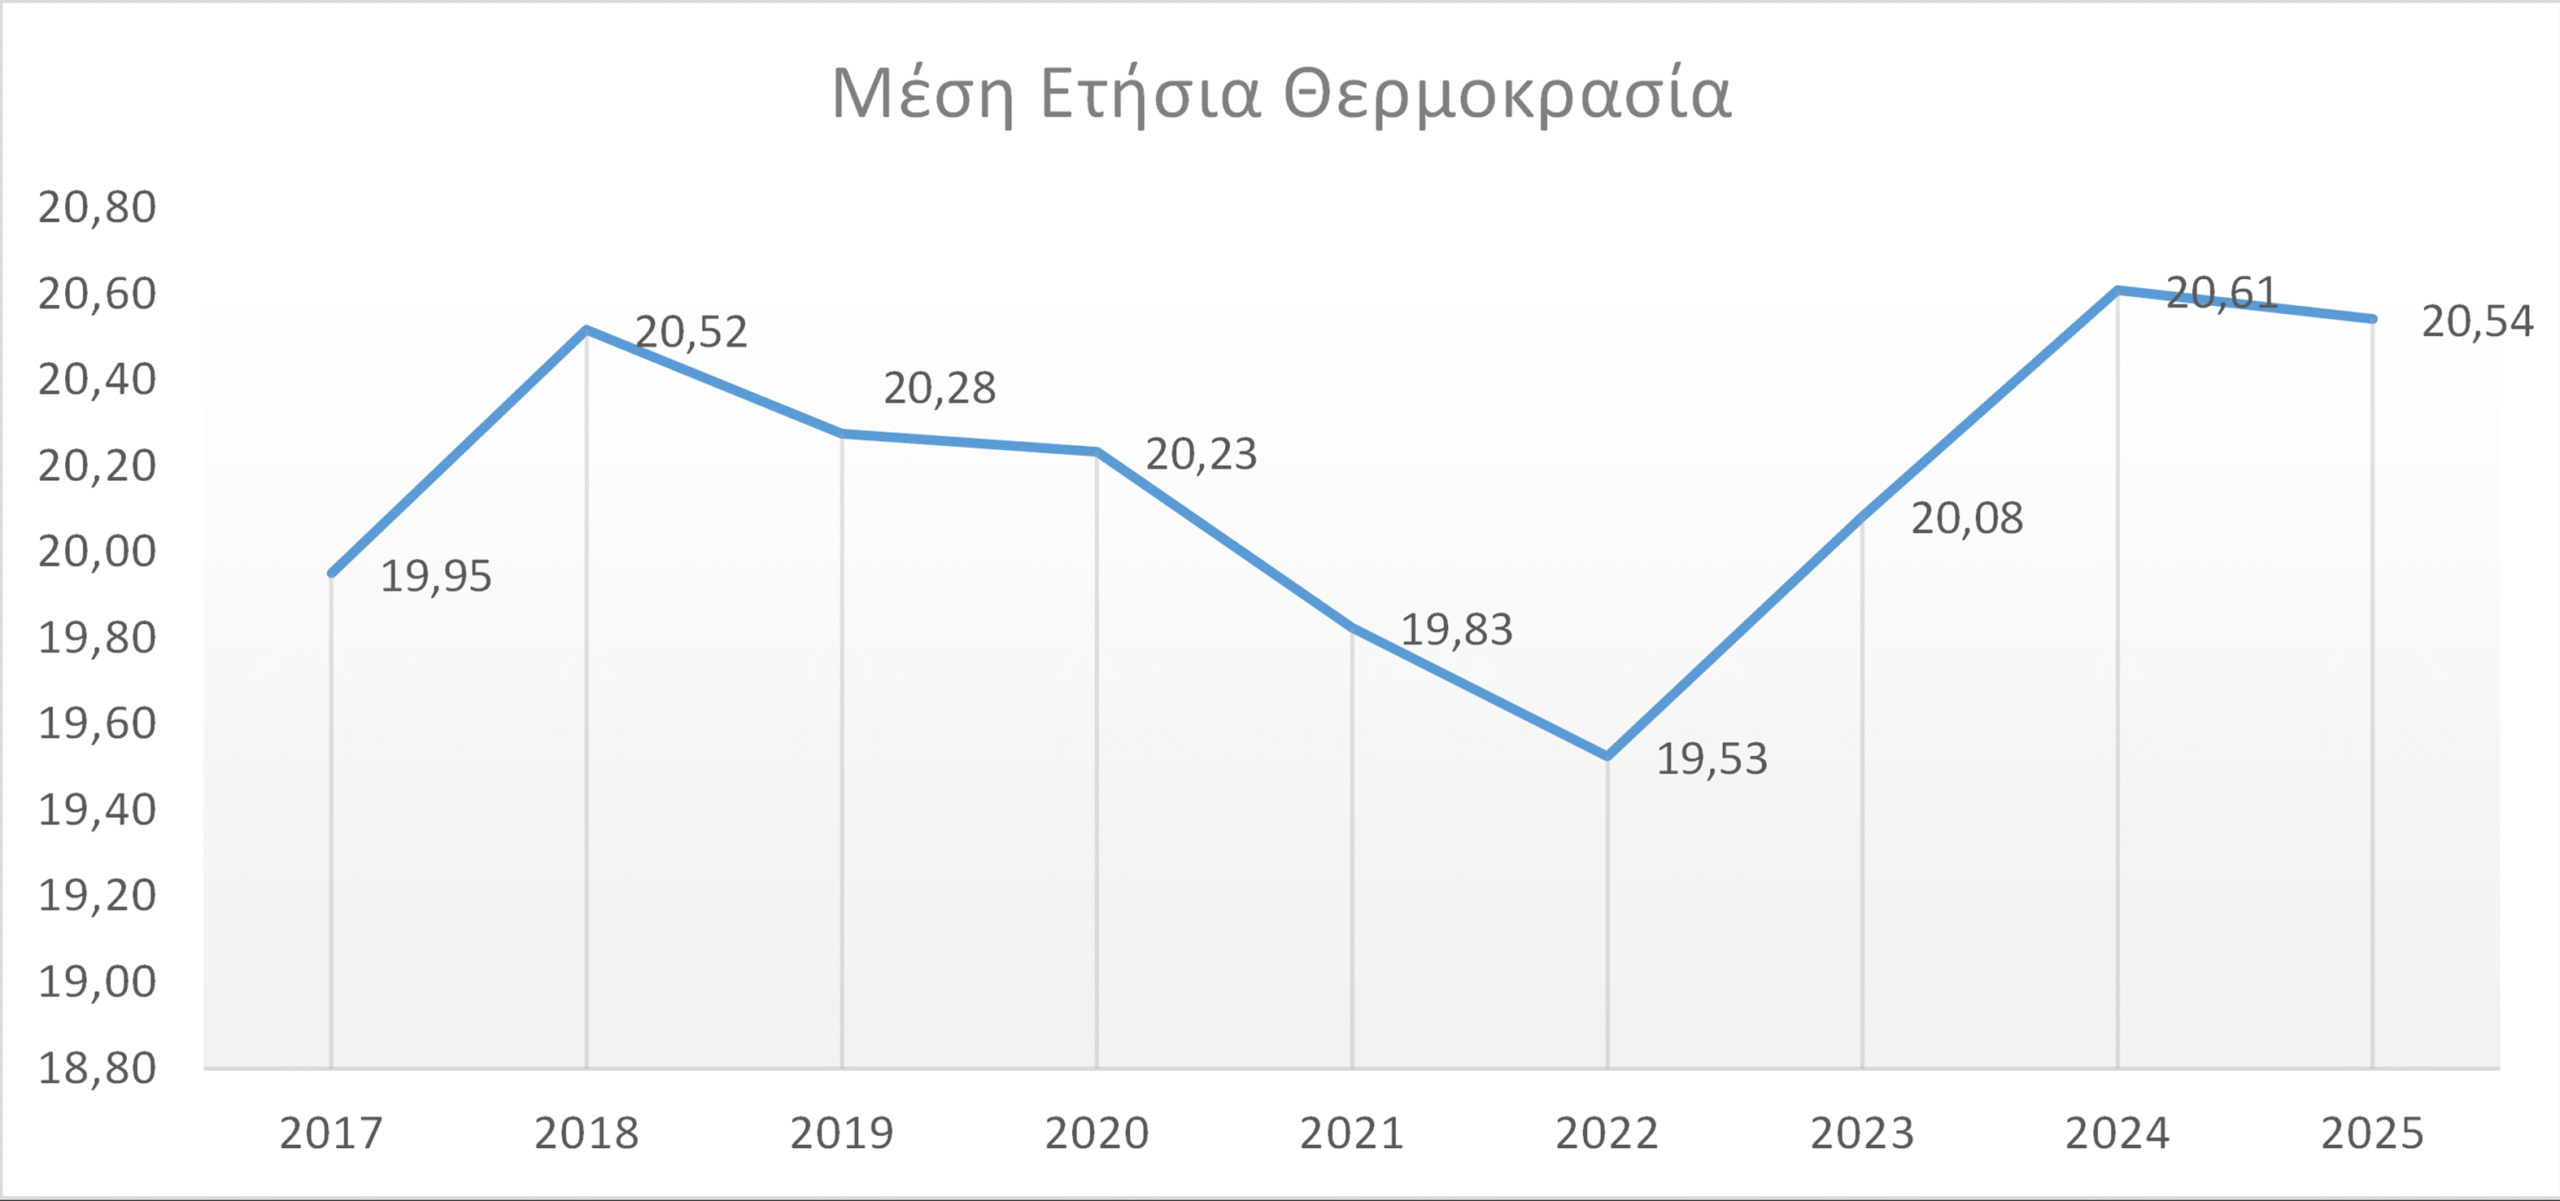
2025 with an average temperature of 20.54 degrees Celsius was the 2or warmest year in the last 19 years. The record thus remains in 2024 with an average temperature of 20.61 degrees (see chart 3).
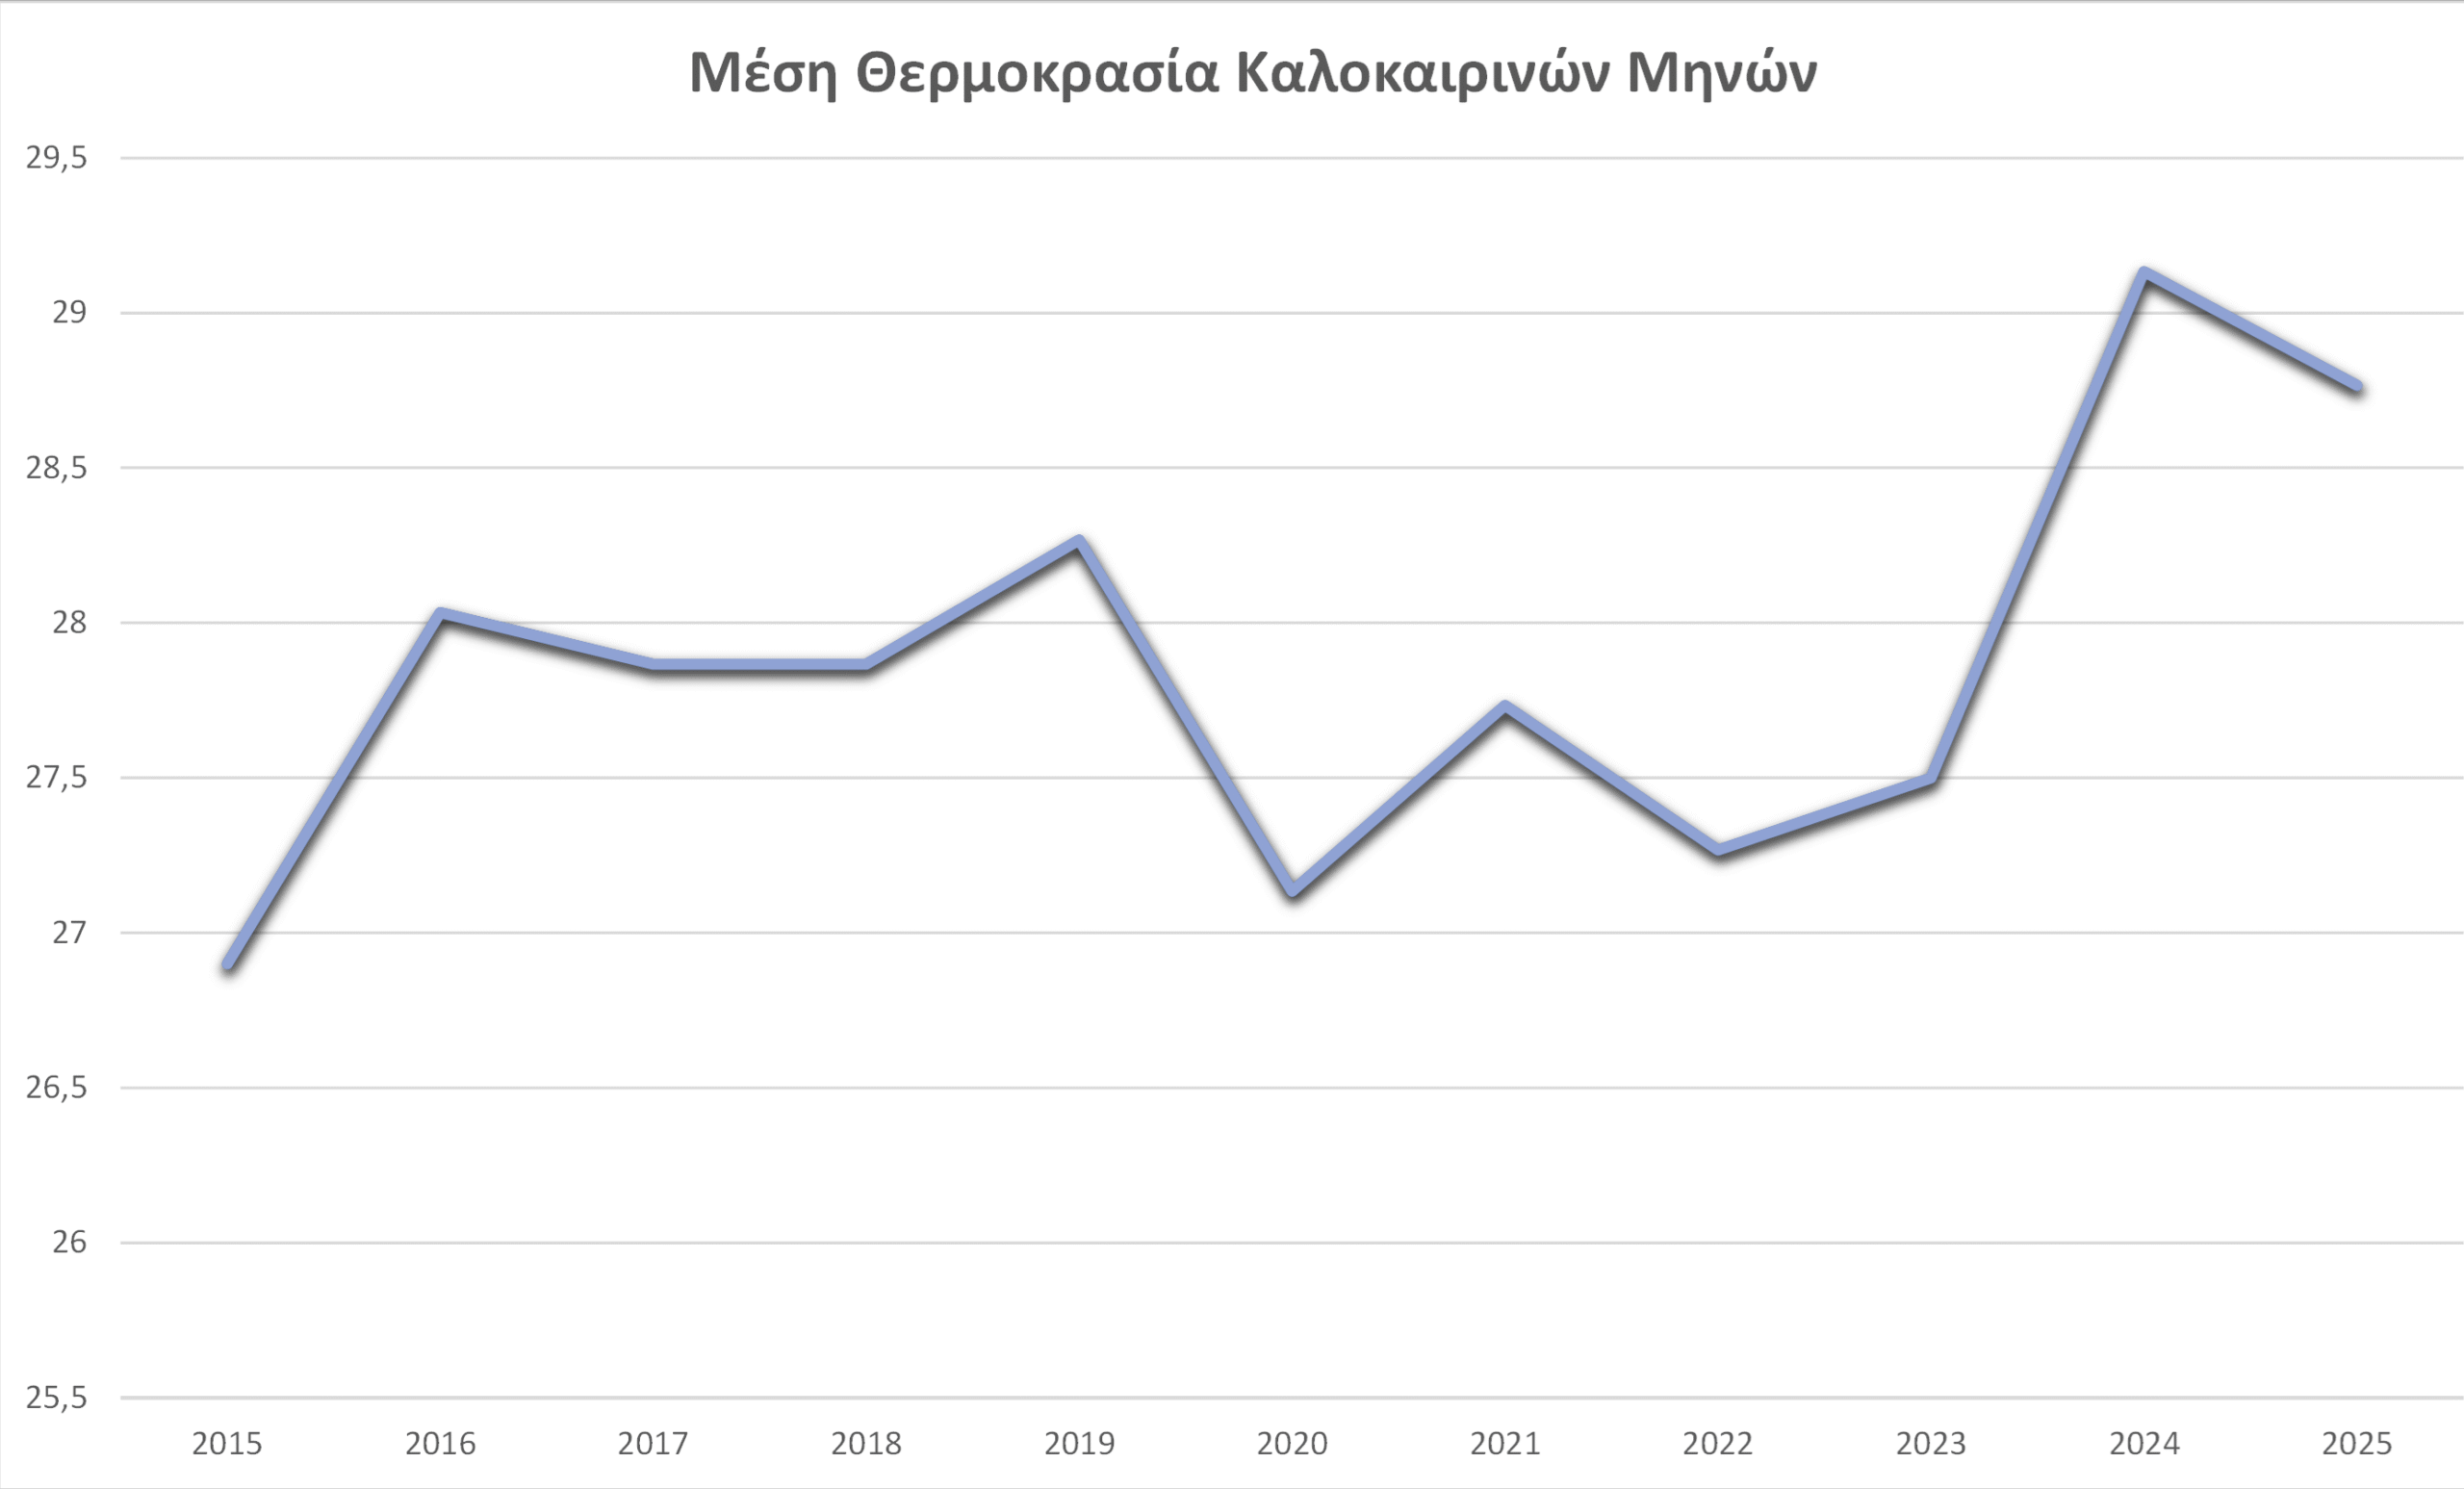
The pattern of 2of The warmest year, as we observe in Figure 4, also applied to the summer of 2025, where although colder than 2024, it clearly stands out from the other summers along with 2024.
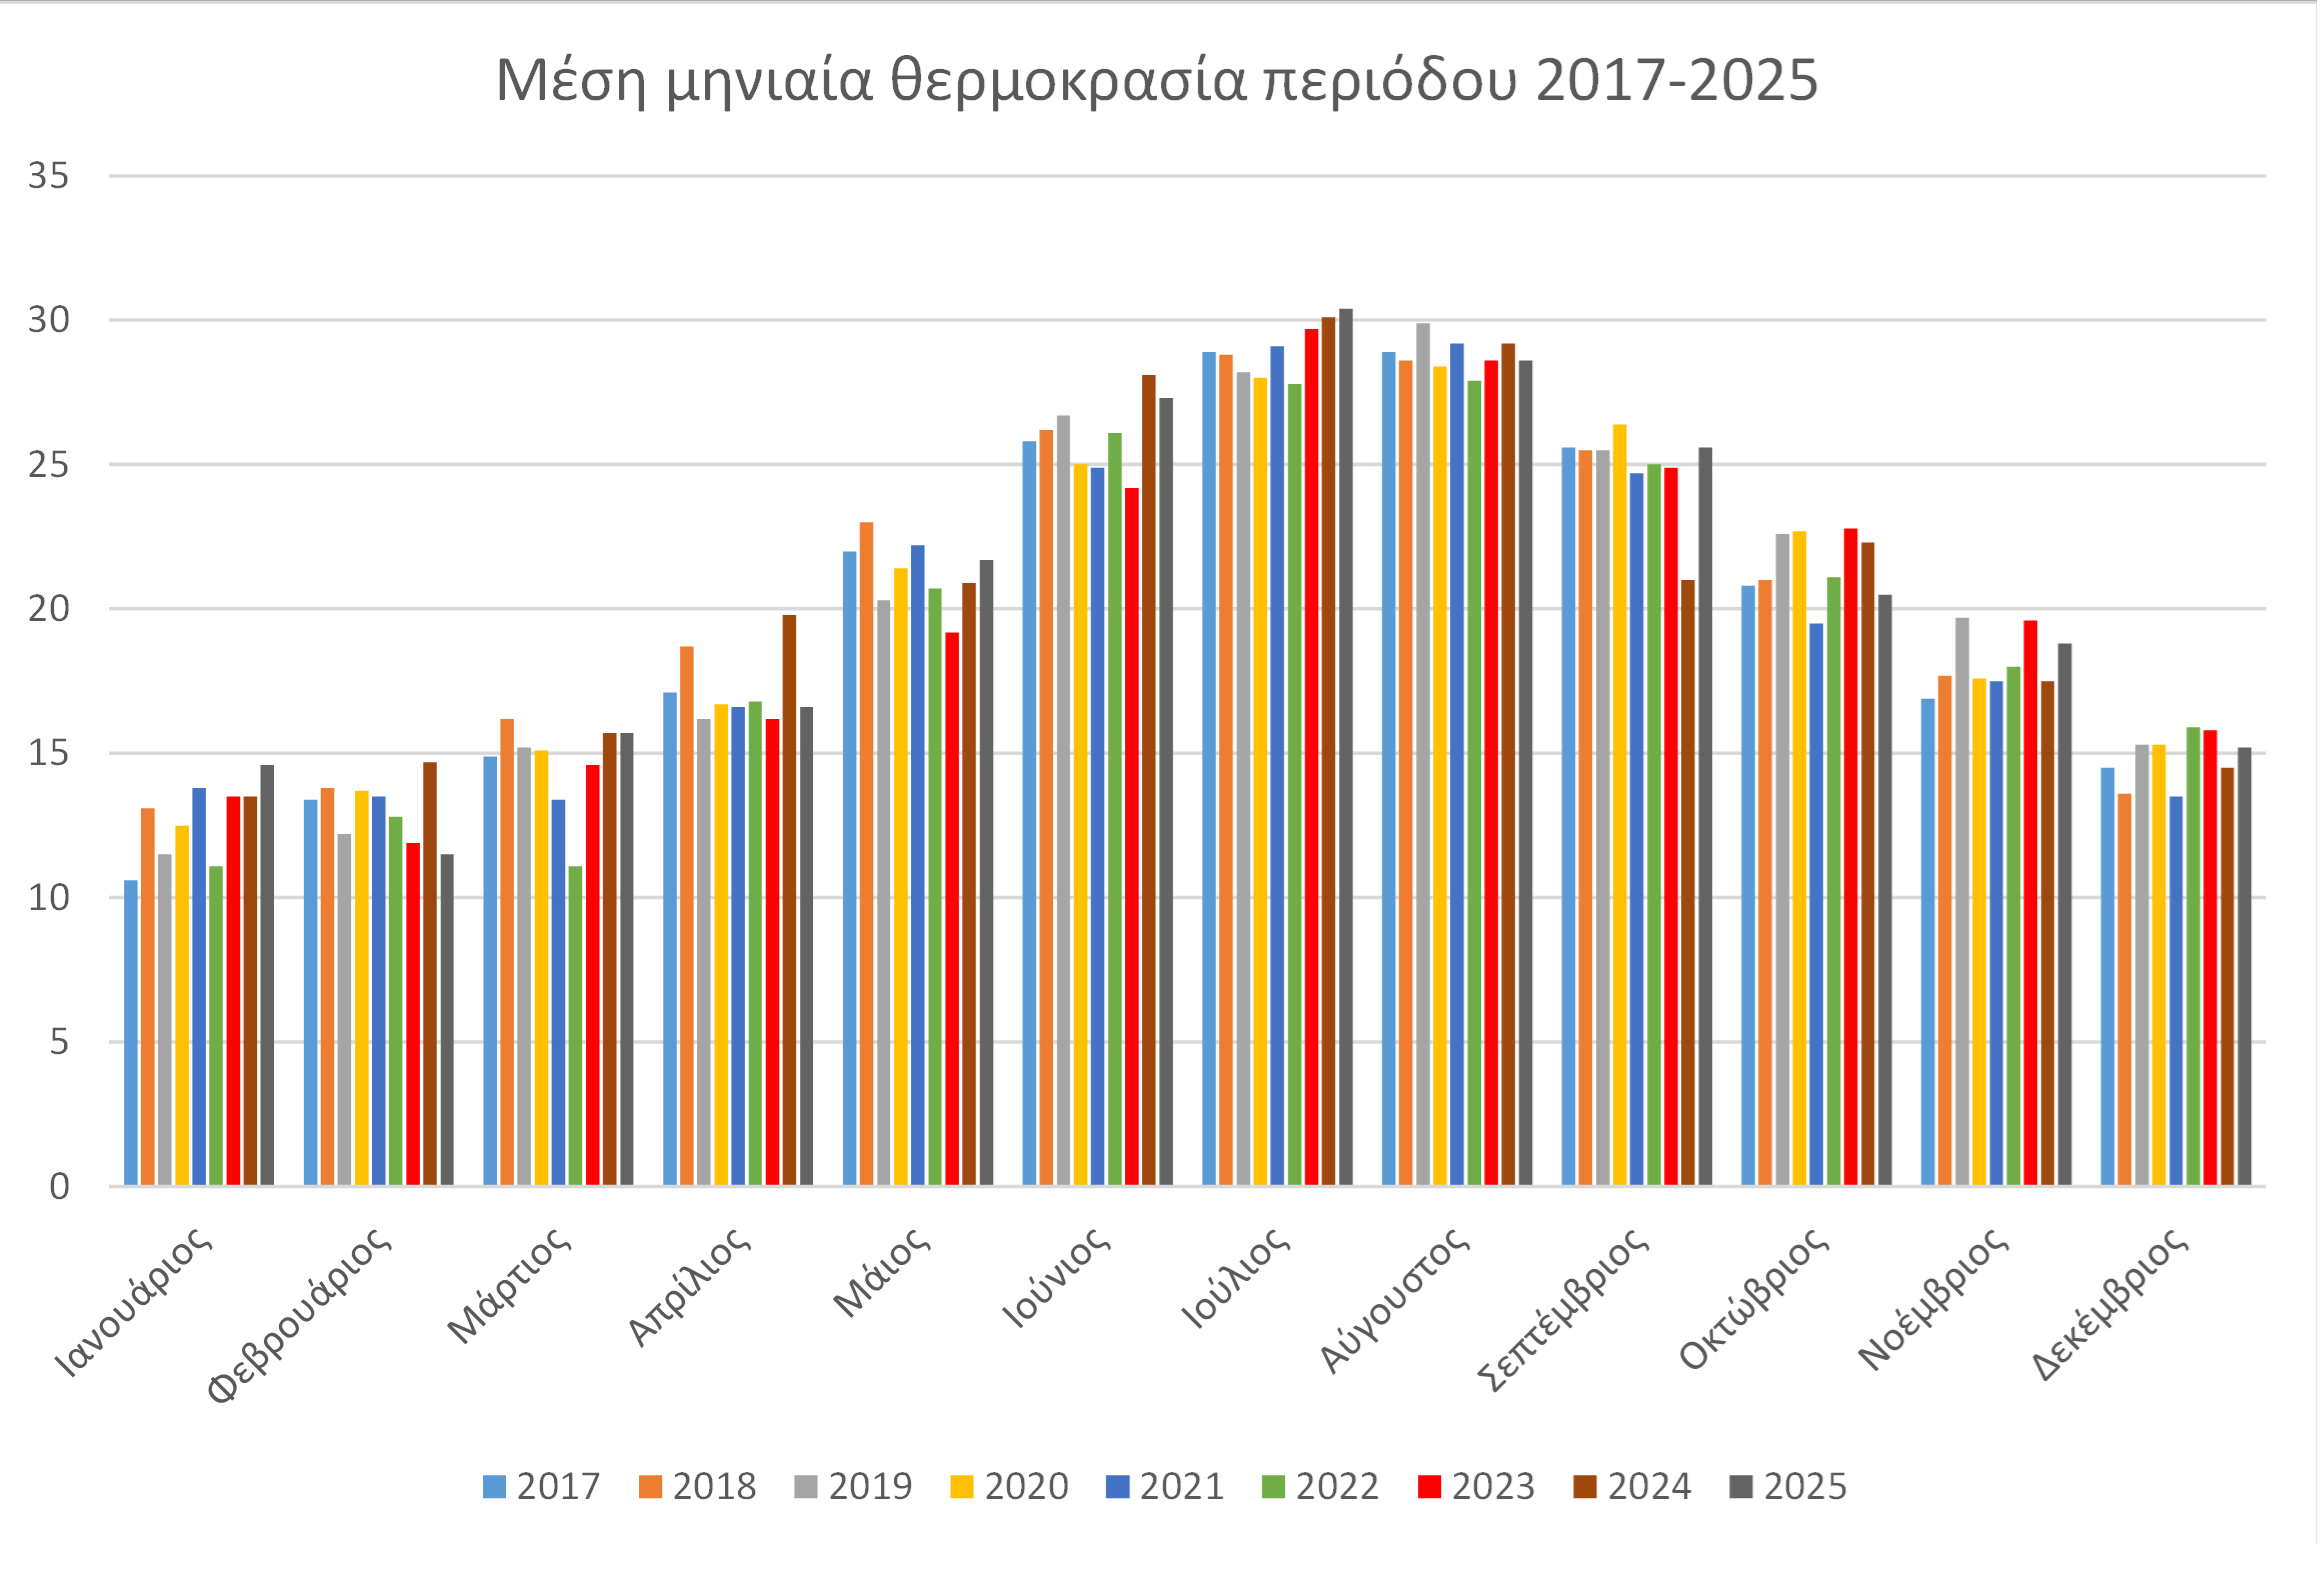
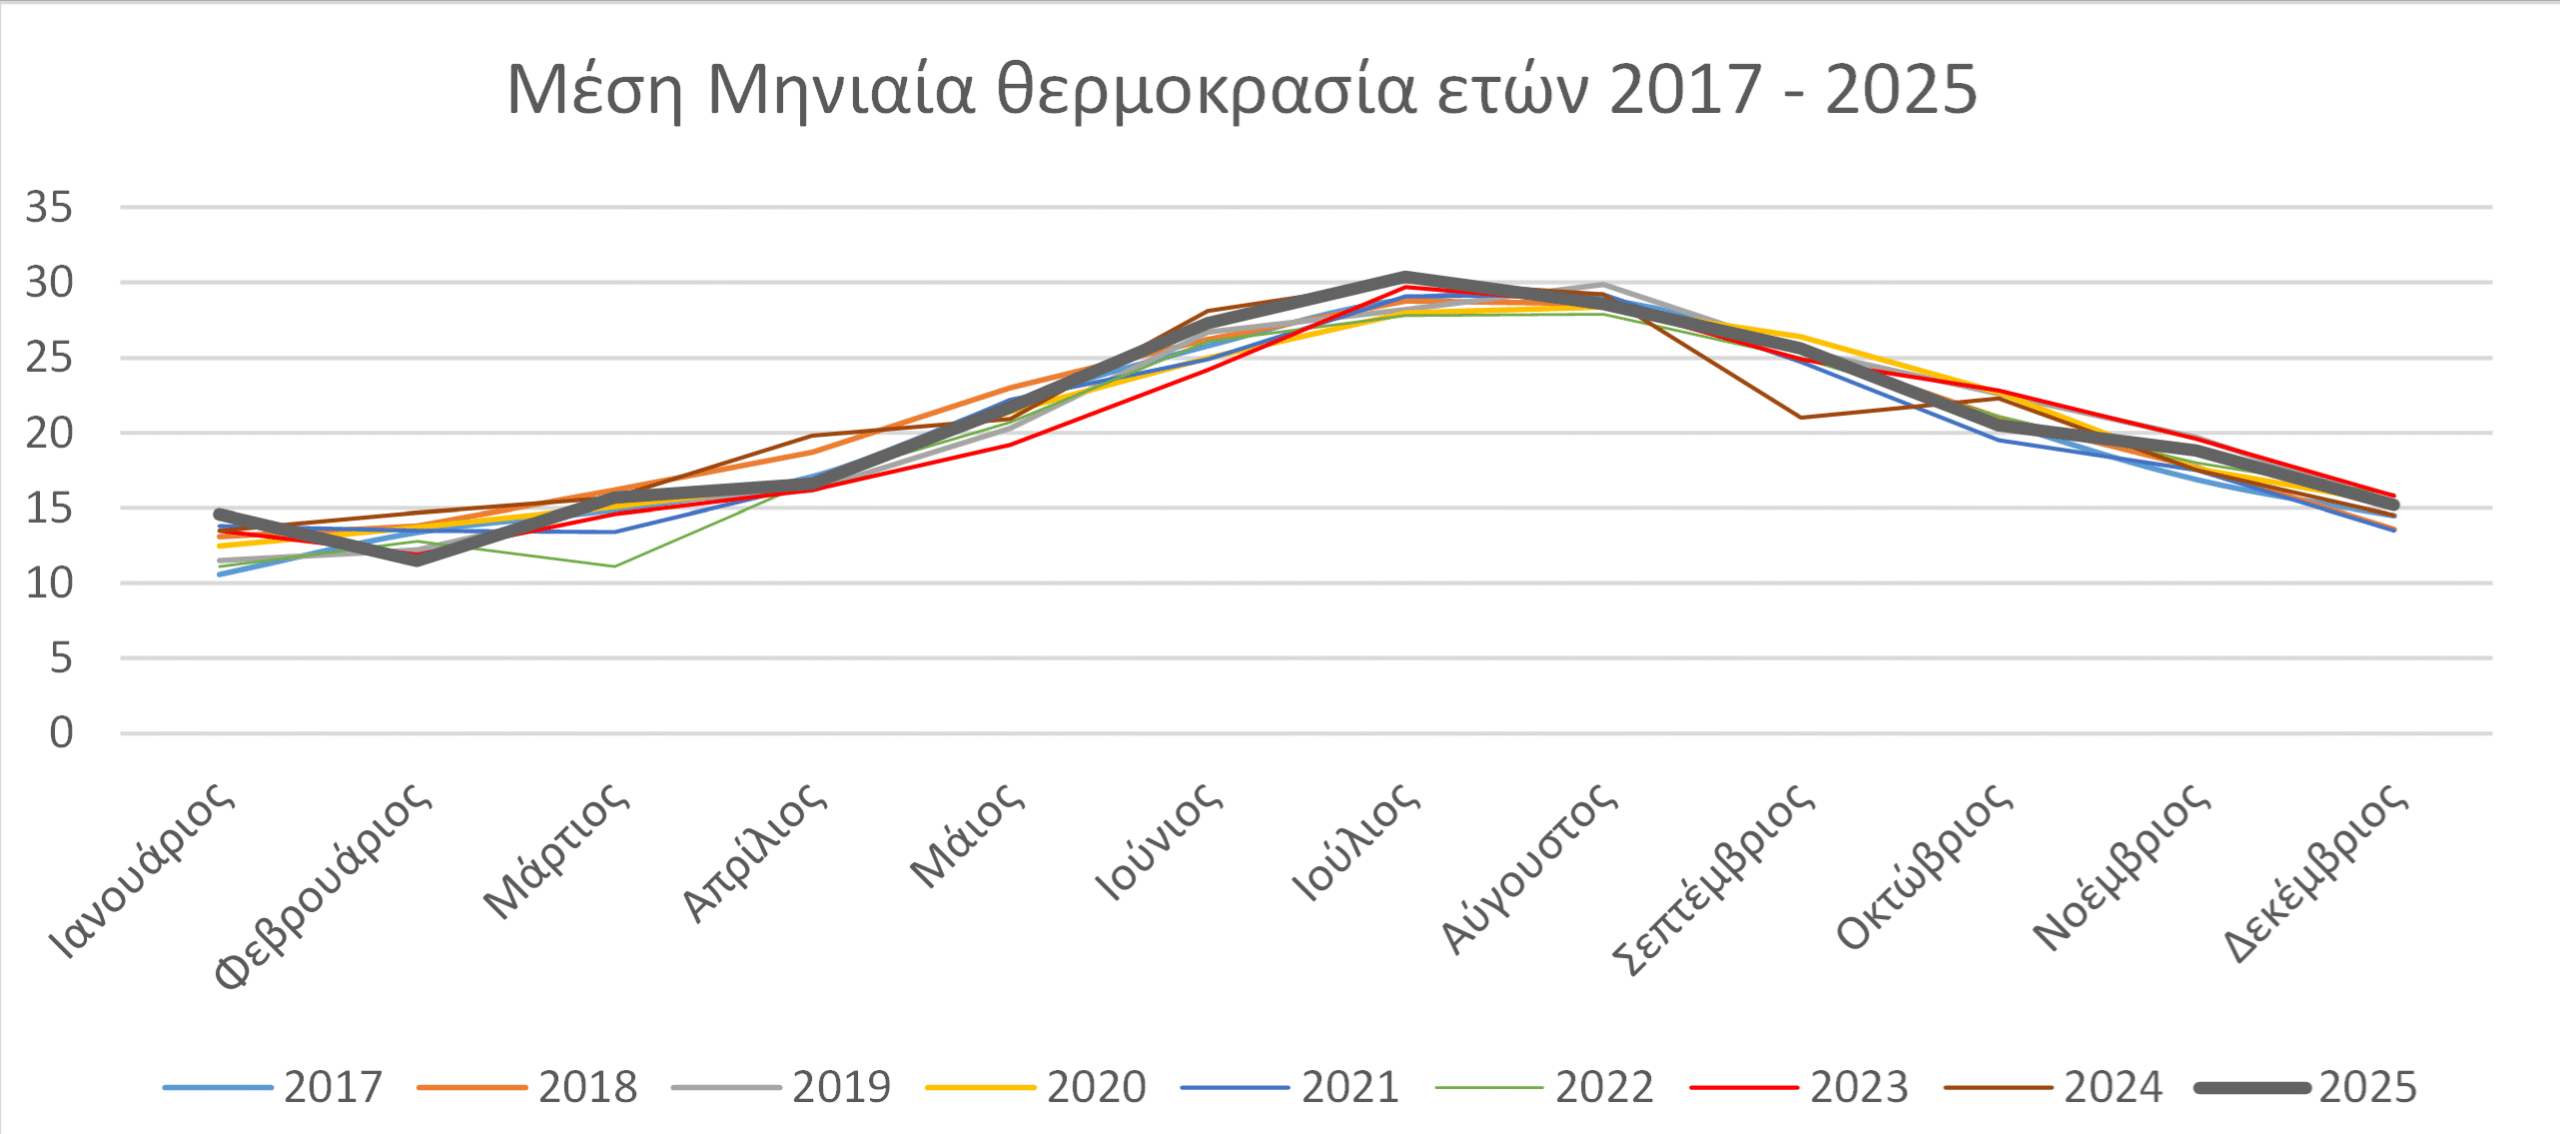
If we look at the average temperature per month (see chart 5 and chart 6), we notice that we had the warmest January and July since 2017. If we focus on the summer months when high temperatures are a problem, we see that June was the 2th warmest since 2024, while August was 4th, that is, generally mild. The maximum temperature exceeded 40 degrees only once in 2025, on July 27th, when it reached 40.1 degrees Celsius.
Wind
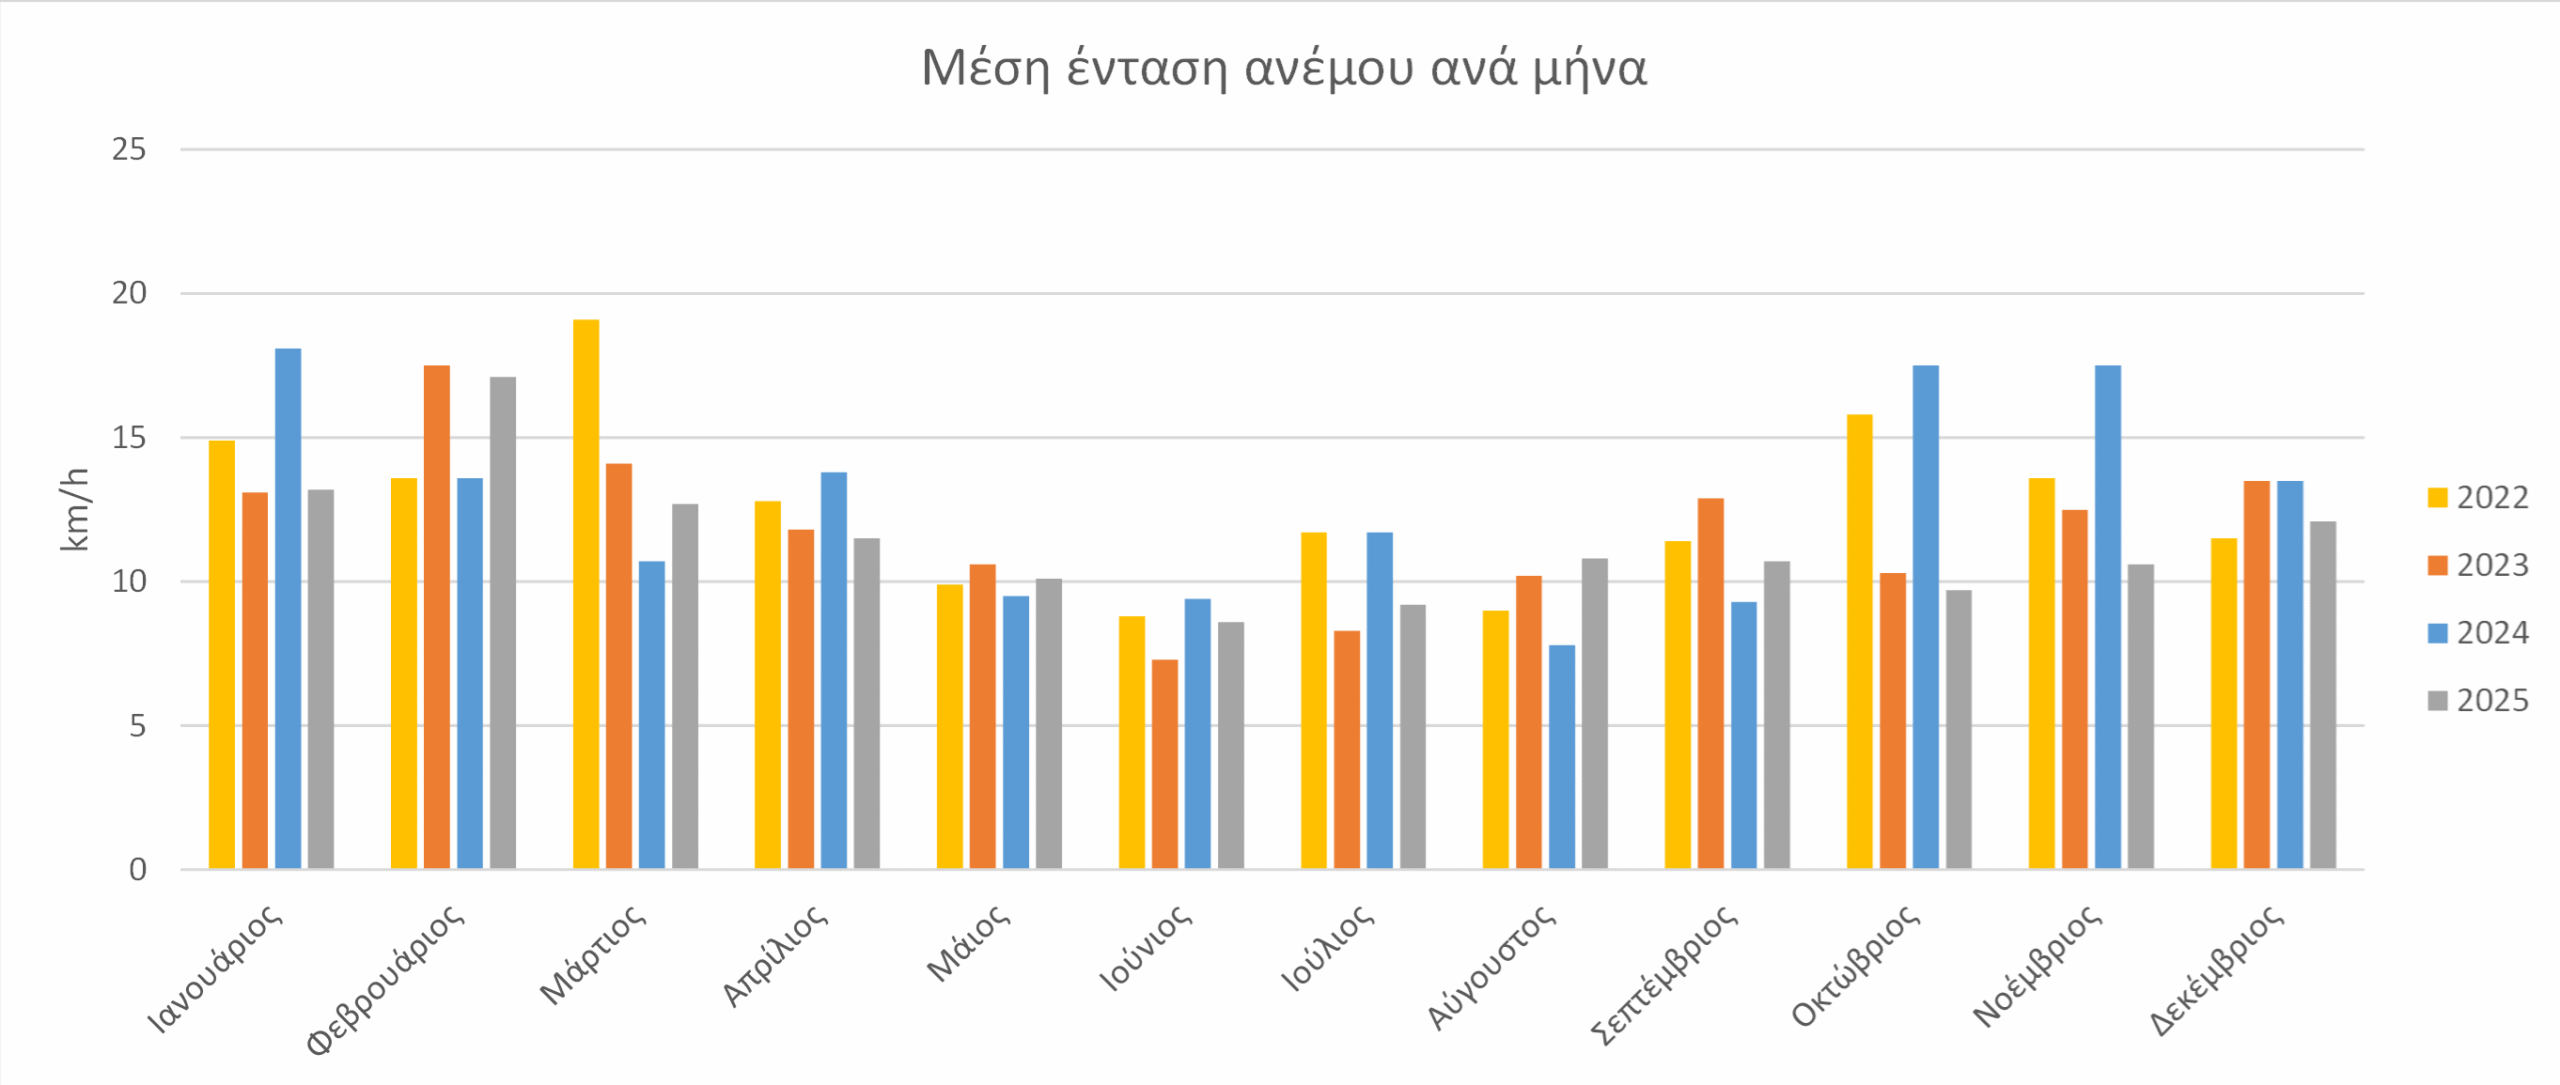
Figure 7 shows the average wind intensity per month from 2022 onwards. The general conclusion is that 2025 was a relatively mild year in terms of wind intensity compared to the previous three years. August 2025 stands out as we can see, which also justifies the milder temperatures, since the strong meltemi that blew from the 4th to the 12th of the month and from the 19th to the 23rd, kept temperatures at tolerable levels. February was also quite windy with 14 days of very strong northerly winds, which contributed to it being the coldest February we have seen since 2017.
The two highest intensities were on August 9 with 83.7 km/h and on February 7 with 82.1 km/h.